Analytics and benchmarking
Two read-only views: Analytics charts your own compliance, risk, policy and vendor figures over a window you choose and can narrate them with AI, and Benchmarking sets your figures beside anonymised peers or published industry baselines.
These two pages answer different questions about the same programme. Analytics looks inward — how are our own numbers moving, and why? Benchmarking looks outward — how do we compare with organisations like ours? Both gather figures that already exist elsewhere in Aegis and present them as cards and charts. Neither lets you edit a record; to change a figure you go to the module it comes from.
Who uses it
Analytics opens to
Contributor and above; a
Viewer does not see it in the menu,
and one who types the address is sent to the access-denied page. Benchmarking
opens to every role, Viewer included, but it is a licensed feature: when
Peer Benchmarking is not on your licence the page shows a short
notice that it is not available on your current plan instead of the cards. Both
pages also need their module switched on for your organisation.
Some controls inside Analytics are gated by permission rather than by role name.
The three AI buttons and the two AI panels below the header need the report-read
permission, and
Export Dashboard needs the report-export permission, which a
Contributor does not hold. That is why the capture below shows no export button,
while a Manager or
Admin sees one. The AI buttons are
also hidden while an administrator has turned AI off for the organisation.
What's on this screen
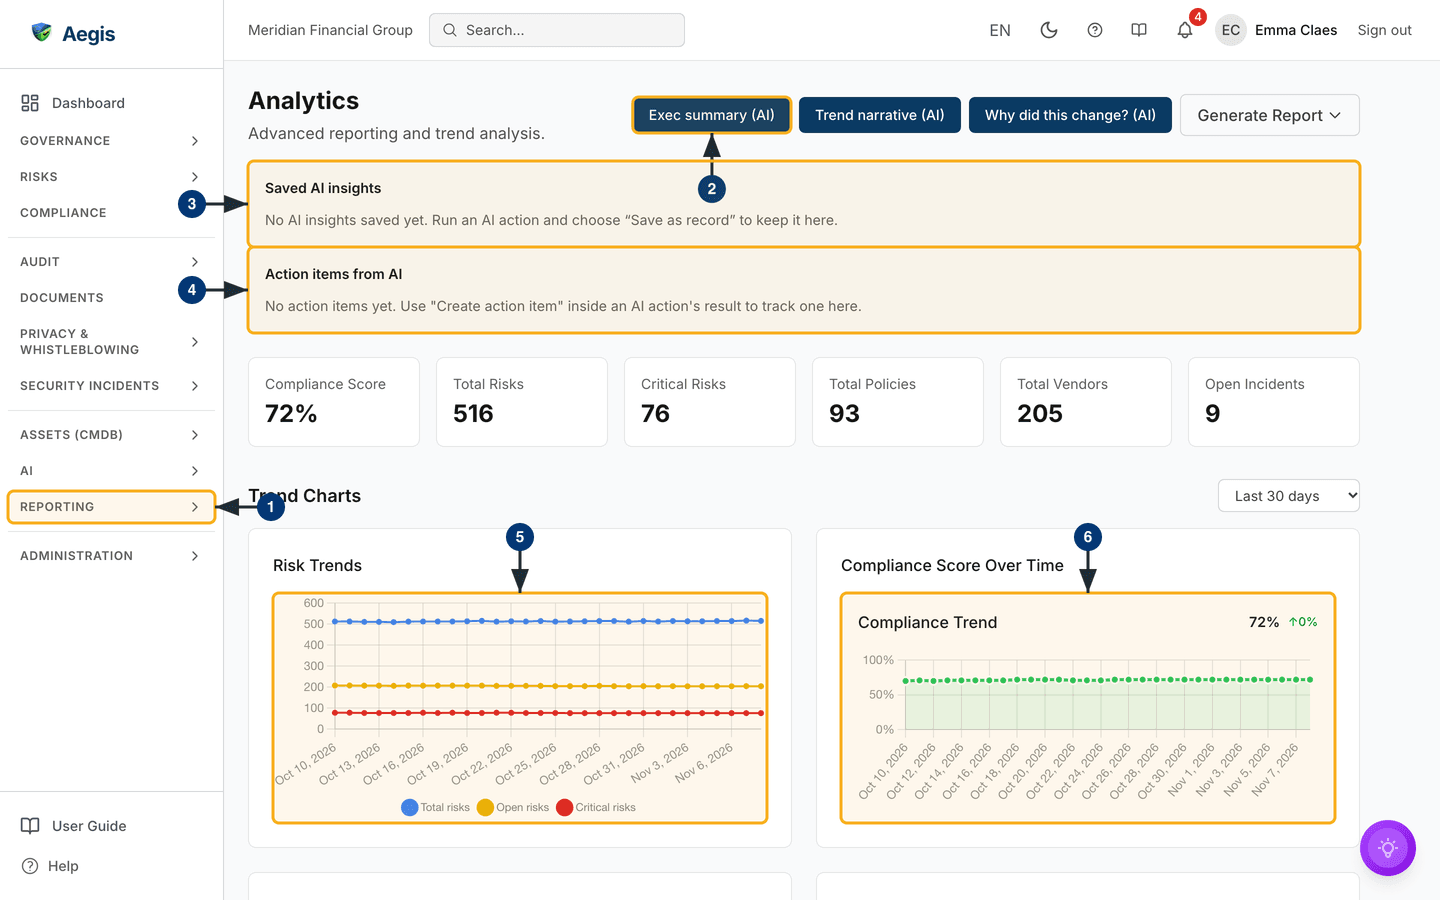
/analytics sits under the Reporting group in the left
menu and opens as one scrolling page. The header carries the title
Analytics with the line "Advanced reporting and trend analysis",
and on the right a row of buttons: Exec summary (AI),
Trend narrative (AI), Why did this change? (AI),
Export Dashboard where your role may export, and
Generate Report.
Below the header sit two panels holding the output of past AI runs.
Saved AI insights lists insights someone chose to keep; on the
captured screen it is empty and reads "No AI insights saved yet. Run an AI
action and choose 'Save as record' to keep it here." Under it,
Action items lists the follow-ups those runs produced; on the
captured screen it is empty too, and says to use
Create action item
inside an AI action's result to track one here.
Next comes a row of six figure cards: Compliance Score,
Total Risks, Critical Risks,
Total Policies, Total Vendors and
Open Incidents — on the captured screen 72%, 516, 76, 93, 205 and
9. Then the Trend Charts heading with a date-range list on its
right (the capture shows Last 30 days) and four line charts in a
two-by-two grid: Risk Trends (lines for total, open and critical
risks), Compliance Score Over Time (the
Compliance Trend line with the current percentage and its change
above it), and below the fold Policy Approvals Over Time (approved
policies and those pending approval) and
Vendor Risk Over Time (active vendors and critical-risk vendors).
Further down, a Current Status heading opens a second block,
labelled "Live snapshot — not affected by the date range above". It holds the
risk heatmap (a grid of impact against
likelihood), Policy Status Distribution,
Vendor Risk Overview, Incident Trends and
Evidence & GDPR Summary.
Open Analytics and read the figures
-
Open the
Reportinggroup in the left menu and chooseAnalytics. The page loads the six figure cards first, then the charts underneath; grey placeholder blocks show while each part is still loading. -
Select
Exec summary (AI)in the header. A window opens over the page explaining what the summary will cover, with aWrite summarybutton — nothing is generated until you press it. The two buttons beside it work the same way; see "Run an AI read-out" below. -
Look at
Saved AI insights. Each kept insight shows when it was saved and where it came from, withShow moreto expand long text,Create action itemto turn it into a follow-up, and, where your role allows, edit and delete buttons. Deleting asks you to confirm first. -
In
Action items, select the circle at the left of a row to move it on:OpenbecomesIn progress, thenDone, then back toOpen. The label under the title changes as soon as it saves. Where your role allows, the pencil button opens an owner list and a due-date field withSaveandCancel, and the bin button deletes the item after a confirmation. -
Read
Risk TrendsunderTrend Charts. Three lines — blue for total risks, amber for open risks, red for critical risks — run across the selected window, one point per stored daily snapshot. A gap in the red line marks an older snapshot whose severity basis is unknown; it is left blank rather than drawn as zero. -
Read
Compliance Score Over Timeon the right for the same window. The current percentage and change indicator sit above the line — on the captured screen, 72% with no change over the window. With nothing to plot the panel saysNo compliance data availablerather than drawing a flat line.
Every trend chart needs stored snapshots inside the chosen window. A new
tenant, or one with no frameworks activated, shows sparse charts — a panel
reads, for example,
No risk data available or
No compliance data available, and
Incident Trends can read Coming soon where that
breakdown is not yet available. That is the page being honest, not an error.
Widen the range, or add the data in the source module. A different message
means a load failed: a single panel reads "Unavailable — this section could
not be loaded", and if the figure cards or all the trend charts fail
together, a red notice says the problem is temporary and offers
Retry. Your data is not affected either way, and the cards
never fall back to a false 0%.
Read the current status block
The Current Status block below the trend charts shows the state of
things now. It ignores the date range.
-
Read the
Risk Heatmap. The grid runs impact against likelihood, and each cell holds the number of open and in-progress risks scored at exactly that pair. Cells are coloured by the severity band (the level a risk's impact × likelihood score falls into), matching the legend below the grid. The figures in the corner give the population — how many active risks the grid holds and how many of them are critical. Closed and accepted risks are not counted here, so this number is normally lower than theTotal Riskscard. -
Select a cell with a number in it. Cells holding at least one risk are links
— Aegis opens the risk register filtered to that
cell's likelihood and impact and to open statuses (
OpenandInProgress), so the register lists the same risks the cell counted. Cells reading0are not clickable. -
Read
Policy Status Distribution(a bar per lifecycle status: draft, in review, partially approved, approved, retired) andVendor Risk Overview(the number of active vendors, with a bar per risk tier from critical to low). -
Read
Incident Trends(the total, with a bar per severity) andEvidence & GDPR Summary(the overall compliance score, a score per active framework with its count of compliant controls, and GDPR controls met where GDPR is active). The last panel scrolls when the list is long.
This block is below the bottom of the captured screen, so the figure above does not show it.
Change the window
-
Open the date-range list beside the
Trend Chartsheading and pickLast 7 days,Last 30 days,Last 90 daysorLast 12 months. The four trend charts redraw against the new window straight away. -
Note what does not move: the six figure cards at the top and the whole
Current Statusblock are a snapshot of today and ignore the range. Only the trend charts respond to it. - Set the range before running an AI action or an export: both read the window you have chosen, and changing it afterwards does not rewrite an answer already on screen.
Run an AI read-out
Three AI actions sit in the header, all working over the selected window and all
read-only.
Exec summary (AI) writes a board-ready summary — bottom line, what
is working, what needs attention, a recommendation.
Trend narrative (AI) describes how the compliance, risk and vendor
figures moved, leading with what is deteriorating or standing still.
Why did this change? (AI) drills into one metric you pick: overall
compliance score, total open risks, critical risks, average risk score, active
vendors or critical-risk vendors.
-
Choose your window, then select one of the three AI buttons. A window opens
describing what the action does — and, for
Why did this change?, aMetric to explainlist. Pick the metric before you start. -
Select the start button (
Write summary,Write narrativeorExplain change). Aegis works through named steps — reading the posture, classifying the direction of travel, then writing — and the text streams in as it is produced. -
Read the answer against the figures it was grounded in. Where the action
reports them, a
Verified figuresblock and aConfidenceindicator sit with the text; check the wording against your own numbers before using it. -
Decide what to keep:
Copyto the clipboard;Export DOCXorExport PDFto download, shown only if your role holds the report-export permission;Save as recordto keep it inSaved AI insightson this page;Create action itemto add a row toAction items;Create work itemsto open a dialog that turns the answer into editable roadmap work items; or run it again from the button that names the action —Rewrite summary,Rewrite narrativeorExplain again.Closediscards an answer you have not kept.
If an administrator has turned AI off while the window is open, the window says so plainly instead of offering a retry that cannot work.
Generate a report or export the dashboard
-
Select
Generate Reportat the top right. A short menu opens beneath it withExecutive Summary,Compliance Status,Risk OverviewandView All Reports. -
Pick a template and Aegis opens the report builder already set to it; pick
View All Reportsfor the Reports list instead. Nothing on the Analytics page changes either way. -
If your role holds the report-export permission, use
Export Dashboardbeside the AI buttons:Export as PDFgives a branded document,Export as CSVthe flat figures, both for the selected window. While the file is prepared the button is disabled. If an export fails, a message says so and nothing is downloaded.
What's on the benchmarking screen
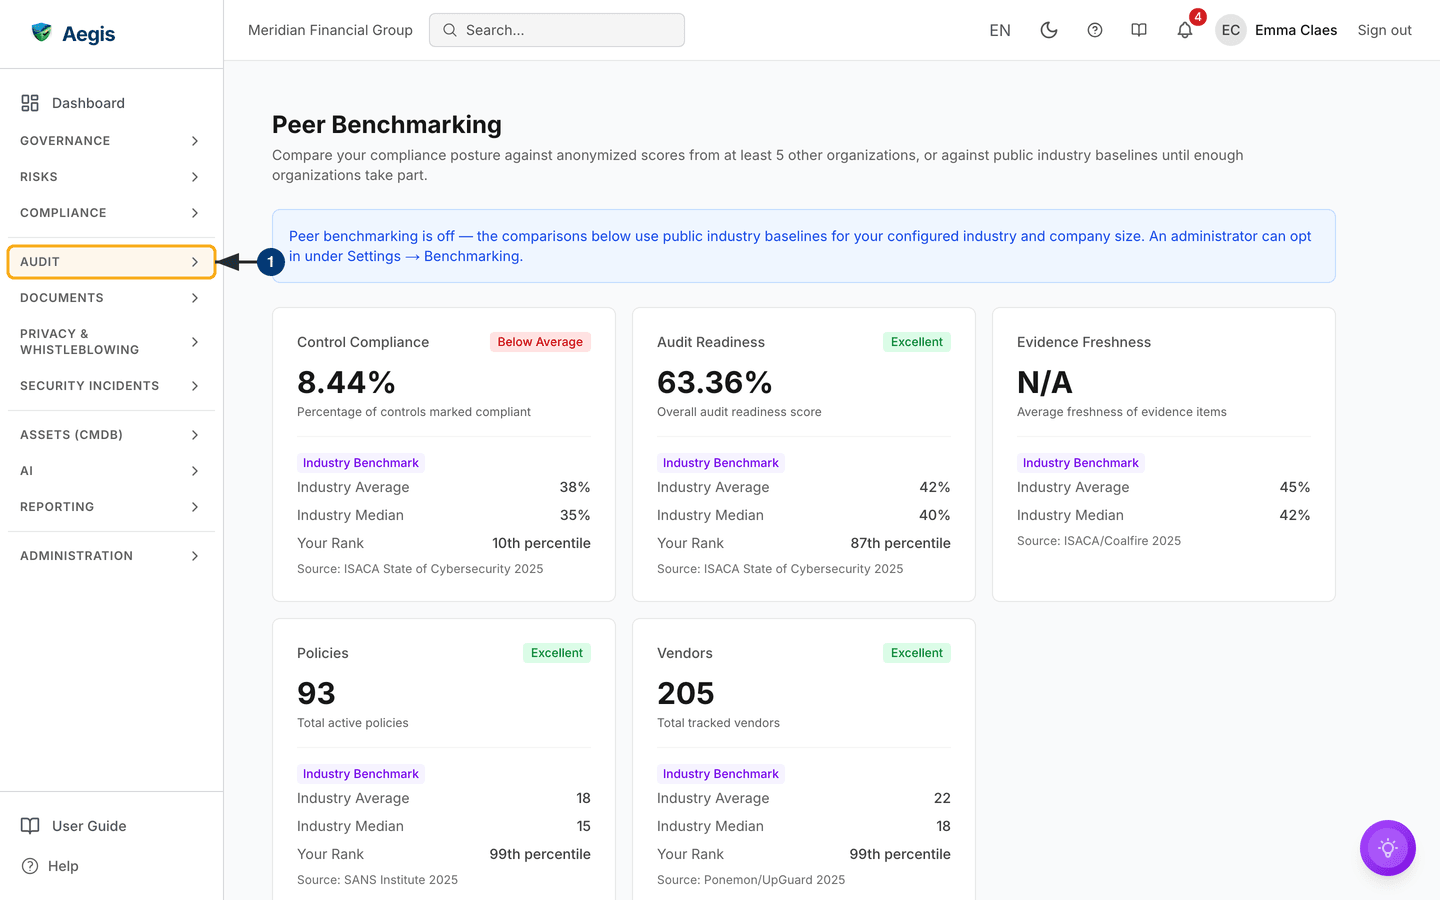
/benchmarking sits under the Audit group in the left
menu. It opens with the title Peer Benchmarking and a line
explaining that your posture is compared against anonymised scores from at least
five other organisations, or against public industry baselines until enough
organisations take part. Where an industry and company size are set in the
benchmarking settings, the line ends with them — for example "Industry:
Financial Services. Size: Micro." On the captured screen none is set, so the
line stops after the explanation.
Below it, a blue notice appears while the organisation has not opted in. It says
peer benchmarking is off and that the comparisons use public industry baselines
for your configured industry and company size. An administrator sees a link to
Settings → Benchmarking in that notice; everyone else, as on the
captured screen, is told an administrator can opt in there. Then five metric
cards — Control Compliance, Audit Readiness,
Evidence Freshness, Policies and
Vendors — each with a tier badge beside its title where a rank
exists, your value, a line saying how it is counted, and a comparison block
underneath. Peer Comparison & Maturity follows below them.
-
Open the
Auditgroup in the left menu and chooseBenchmarking. Read the line under the title first — when a segment is configured, it tells you which industry and size band the figures are matched to. -
Scroll past the five cards to
Peer Comparison & Maturity, below the bottom of the capture. It holds a maturity score, a radar chart of your values against the peer average, and a table of five dimensions — policy coverage, risk maturity, incident response, vendor management, evidence freshness — each with your value, the peer average, your percentile and your trend. Where earlier scores are stored, aYour Maturity Trendline follows. The whole section only appears once comparison data has loaded, and the table saysNo comparison data available.when there is nothing to compare.
Each card carries the same parts:
| Part of the card | What it means |
|---|---|
| Your value |
Your own figure, with a line saying how it is counted. It reads
N/A when Aegis has nothing to measure yet — on the
captured screen, Evidence Freshness.
|
| Tier badge |
A banding of your percentile: Excellent from the 75th,
Good from the 50th, Average from the 25th,
otherwise Below Average. No badge appears when there is
no rank.
|
| Source label |
Industry Benchmark means a published baseline, with
rows reading Industry Average and
Industry Median. Where enough peers have opted in, the
rows read Peer Average and
Peer Median instead, with a Peers row
giving the number of organisations.
|
| Average and median | The middle of the comparison set; one outlier moves the average. |
Your Rank and source line |
Your percentile within that set, and the study the baseline came
from — the captured screen cites ISACA State of Cybersecurity 2025,
ISACA/Coalfire 2025, SANS Institute 2025 and Ponemon/UpGuard 2025. A
card with no comparison data says
No peer data available yet.
|
On the captured screen, Policies shows 93 with an
Excellent badge at the 99th percentile against an industry
average of 18, while Control Compliance shows 8.44% with
Below Average at the 10th. The badge only bands your percentile
within the comparison set. A count such as the number of policies says
nothing about their quality, and a thin or baseline-driven set can push a
figure into a flattering or an unflattering band. Read the badge with your
own value, the median and the source line before drawing any conclusion.
The AI assist
The three AI actions write about figures Aegis has already calculated; they do not calculate them. Direction of travel — improving, deteriorating or standing still — is classified by Aegis from the stored snapshots, and the AI narrates that classification. Every run is started by a person, over a window that person chose, and the result stays on screen until someone copies, exports, saves or discards it. Saving an insight, creating an action item or creating work items are deliberate choices; the AI never edits a record, changes a status or files anything by itself. Each billable AI action draws one credit from your tenant's monthly allowance. Benchmarking has no AI.
Tips and limits
- A compliance score is a guide, not a grade: a high number means few known gaps today, not that the work is done.
-
The six figure cards and the
Current Statusblock ignore the date range. If a trend chart looks empty, widen the range before assuming something is wrong. - The trend charts draw from stored daily snapshots, so a change made today shows in the cards and the current-status block at once but reaches the trend lines only with the next snapshot.
- Treat an AI summary as a first draft. Compare it with the figures on the page, and keep it only once you agree with it.
- A true peer comparison needs at least five opted-in organisations in your segment. Below that, a card falls back to a labelled industry baseline — read that as "not enough comparison yet" rather than a fault in your own figure.
-
Sharing your own anonymised metrics is opt-in, stays under
Settings → Benchmarking(administrators only), and never names an individual organisation.
Where this connects
The figures come from Compliance frameworks, Risks, Policies, Vendors, Incidents and Evidence. Follow-ups collect in Action items and, as work items, in the Roadmap; documents are built in Reports and Board reports; the peer opt-in lives in Settings. Roles are set out in What each role can do.