The screen layout
Every signed-in page in Aegis sits inside the same frame — sidebar on the left, top bar across the top, working area in the middle — so once you learn the frame, you can find anything.
This chapter is a tour of that frame. It uses the dashboard as the example screen, because that is where you land after signing in, but the sidebar and top bar are identical on every page. Learn them once and the rest of this guide can get straight to the task in hand.
Who uses it
Everyone sees the same frame, but not the same contents. A Viewer sees the same pages as a Contributor, but the buttons that create or change things are not rendered. A Contributor can create and edit records in most modules. A Manager adds approvals, board-level reporting and connector setup. An Admin adds user, role, licence and integration management. A group heading appears only when at least one item inside it is available to you, and the sidebar hides any module your organisation has not licensed or has not switched on — so a colleague's menu may be longer or shorter than yours. Roles at a glance sets out what each role can do.
Where your organisation offers the Coach view (a guided alternative
to the dashboard) and you have chosen it, signing in takes you to
/coach instead of the dashboard. The frame described here is the
same in both.
What's on this screen
The screenshot below was captured as a Contributor on the
/dashboard route of a local Aegis loaded with fictional demo data
for an organisation called Meridian Financial Group, so the figures in it are
not yours. The frame around those figures is the real thing.
Across the top is the top bar. On the left sits your
organisation's name (here Meridian Financial Group), then the
search box marked Search…. On the right is a row of account-wide
controls, in this order: the language switch (EN), a moon icon that
toggles light and dark appearance, a circled ? that opens the
Help Center panel, an open-book icon that opens the User Guide at
the chapter for the page you are on, the notifications bell with its unread
count (here 4), your initials and name (Emma Claes in
the capture), and Sign out. Your initials and name are one link:
select either to open your own profile page. Where your organisation offers the
Coach view, a Coach view switch sits between your name and
Sign out; it is not offered in the capture. On a narrow screen the
organisation name, the name label and the word inside the search box drop away,
and Sign out shrinks to an icon; the controls themselves stay.
Down the left is the sidebar
(the column of module links). At the top is the Aegis mark, which
returns you to the dashboard from anywhere. Below it,
Dashboard sits on its own as a top-level item, then come the eleven
group headings in the order captured here: GOVERNANCE,
RISKS, COMPLIANCE, AUDIT,
DOCUMENTS, PRIVACY & WHISTLEBLOWING,
SECURITY INCIDENTS, ASSETS (CMDB), AI,
REPORTING and ADMINISTRATION, with thin dividers
separating the core groups from the supporting ones. Each heading carries a
chevron and starts collapsed, which is why the capture shows headings rather
than links. At the very bottom, below a rule, sit User Guide and
Help.
The rest of the screen is the working area. On the dashboard
that means the page title Dashboard and its one-line description,
then a toolbar row holding What needs my attention? and
Ask AI on the left and Refresh on the right, a
Customize button beneath, and the widget grid itself. While your
organisation's setup is unfinished, a Getting Started banner
showing setup progress sits above the toolbar, with a chevron to collapse it and
an × to dismiss it; it is absent from the capture. Below the grid,
two lists collect AI insights and action items that someone chose to keep from
the dashboard's AI features. Every other module reuses the same shape: a title,
a toolbar, then the content — usually a list or table, with a detail view when
you open one record.
Bottom right, a round violet button floats above the page — the AI assistant, which stays in that corner wherever you go.
Read the working area at a glance
The numbered callouts on the figure below walk the dashboard from the toolbar down to the charts. The headline cards are also shortcuts: each one is a link into the module it summarises, most of them opened on a filtered list, so that row doubles as a way in.
-
The toolbar sits under the page title.
What needs my attention?asks the AI for a briefing of what is pressing across your modules,Ask AIbeside it opens the assistant on your overall posture, andRefreshat the far right of the same row pulls new figures.Customizesits on the row beneath. -
The
Compliancecard opens the grid with your overall score — in the captured screen72%, described asControls with approved evidence. Select it to open/compliance. The cards beside it behave the same way and open their module already filtered:Policies(active policies,92in the capture),Open Risks(204of516),Vendors(171, of which84high-risk) and, on the second row,Pending Reviews(41policies needing review). -
The small
?in the corner of a card — called out here onOpen Risks— asks the AI to explain that metric in plain words. Five cards carry it:Compliance,Policies,Open Risks,VendorsandPending Reviews. -
Framework Progress, on the right, lists the frameworks it has room for with their completion — five of them in this capture, fromEU AI Actat37%toGDPRat91%— and closes with a+6 moreline counting the frameworks it could not show. That line is a count, not a link. A bar is green from70%, amber from40%and red below that, and the percentage beside it carries the same reading. -
Compliance Trend, below the cards, plots the score over time, with the latest value and its change beside the title (72%, up2%, in the capture). TheAll frameworksdropdown narrows the chart to a single framework. -
Risk Heatmap, underFramework Progress, counts your active and critical risks and places them on a likelihood-by-impact grid. Select a coloured cell to open the risk list filtered to that cell's open risks.
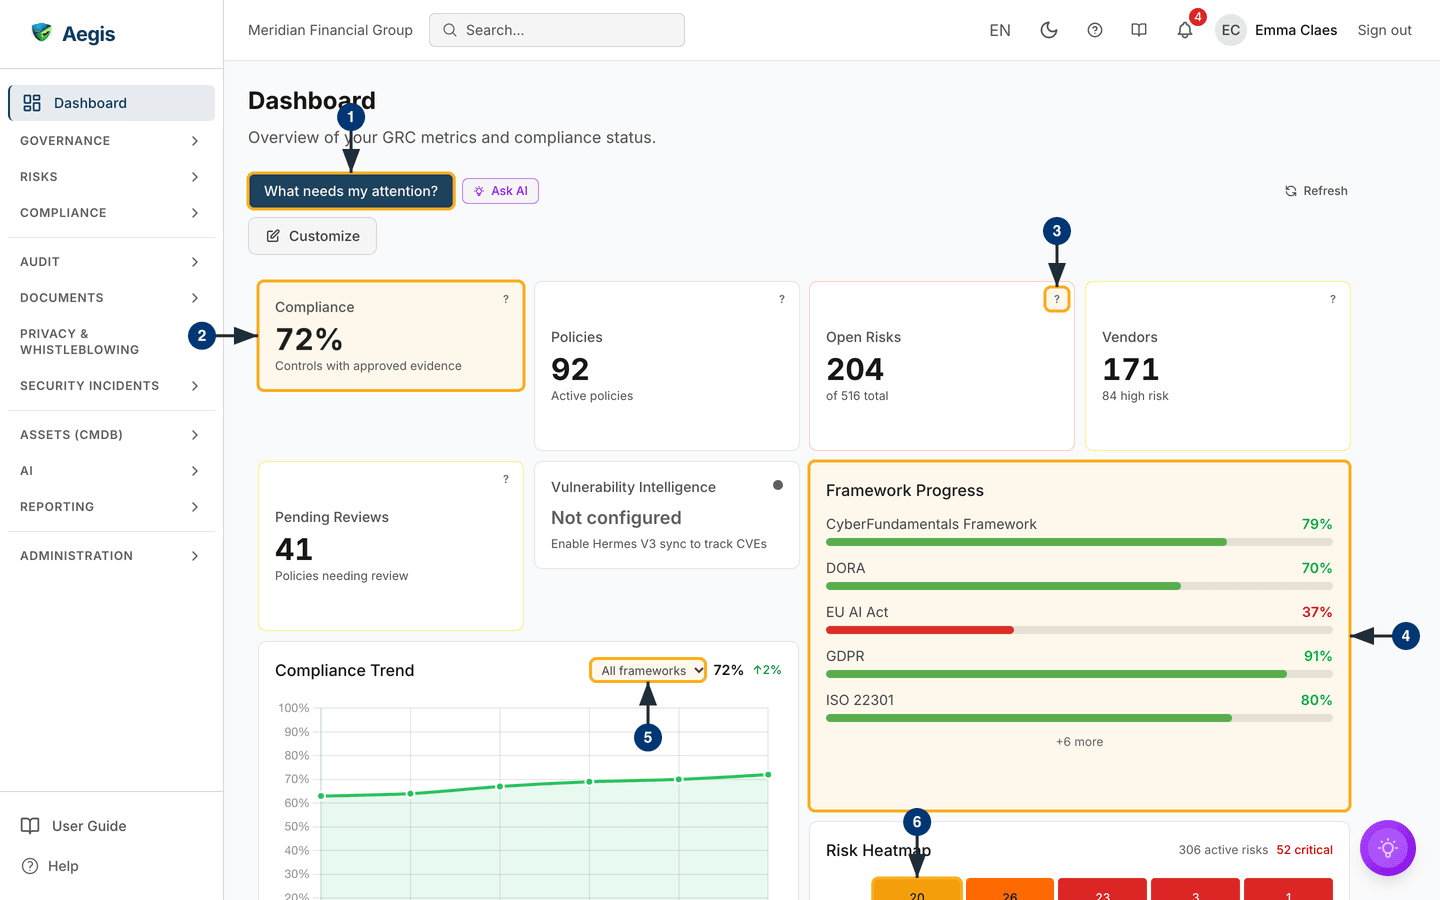
One card in the grid is not a counter:
Vulnerability Intelligence shows the state of a connected
vulnerability feed. In the capture it reads Not configured, with
the prompt Enable Hermes V3 sync to track CVEs, because no feed is
connected on that demo organisation. Once a feed is connected it shows how many
CVEs (published software vulnerabilities) are tracked and how many are actively
exploited. It carries no ? explainer.
The capture comes from fictional demo records, so its scores and counts say nothing about your organisation. Your own figures move as you map controls, attach evidence and complete reviews — a score in Aegis is a live reading of your records, never a final mark.
Moving around with the sidebar
The sidebar is your main way between modules. Because groups start collapsed, reaching one takes an extra step the first time:
-
Select a group heading —
COMPLIANCE, for example. The chevron rotates and the group's links slide open beneath it. - Select the link you want. The page loads in the working area and the link stays highlighted, so you can see where you are. Opening a page never opens or closes a group for you.
- Select the heading again to collapse the group. Aegis remembers which groups you left open and restores them next time, in that browser.
Two more details are worth knowing. A link can carry a small count badge when
items are pending, capped at 99+; on some links the badge is its
own link that opens the list filtered to the pending items — the Policies badge,
for instance, opens the policies awaiting review. And the right-hand edge of the
sidebar is a drag handle: pull it left or right so long module names fit, or
focus it with the keyboard and use the left and right arrow keys — the width is
remembered in that browser. Below about 1024 pixels the sidebar becomes a
slide-out drawer, opened by the button at the very top left.
At the foot of the sidebar, User Guide opens this guide and
Help opens your organisation's support details — contact address,
phone, support hours and support tier, as configured for your organisation.
Pressing ? anywhere outside a text field opens the same support
window.
The left menu at a glance lists every group and item, each linking to its own chapter — use it as the map when you know what you want but not where it lives.
Finding a record with search
Search saves you from remembering which module a record lives in. It covers policies, risks, vendors, evidence, incidents, procedures and connectors, and it indexes the pages themselves, so you can also use it to jump to a screen.
-
Select the
Search…box in the top bar. A search panel opens over the page with the cursor already in the field. -
Type at least two characters. Results appear as you type, grouped by what
they are, with a
Pagesgroup for destinations that match. -
Move through the results with the up and down arrow keys and open the
highlighted one with
Enter, or select it with the mouse.Esccloses the panel without opening anything.
The search box shows a ⌘K or Ctrl+K hint only when
that chord opens this search. Where the keyboard-shortcuts feature is
switched on, the chord opens the command palette instead and the hint is
hidden — which is why none appears in the capture above. Selecting the box
always works.
Getting help on the page you are on
Two neighbouring icons in the top bar look alike but open different things.
-
The circled
?opens theHelp Center, a panel that slides in from the side with short help topics, aSearch documentation...box and, where configured, anOpen Documentation Portallink. Where the keyboard-shortcuts feature is off,Ctrl+/opens and closes the same panel, and the panel's own search box shows that hint. - The open-book icon opens this User Guide at the chapter that matches the screen you are on.
Keeping up with notifications
The bell collects the things waiting on you: an approval, a review falling due,
a record assigned to you, a status that has changed. Its badge counts unread
items, capped at
99+.
-
Select the bell. A panel drops down headed
Notifications, listing your ten most recent entries, each with what happened and when. With nothing waiting it readsNo notifications yet. -
Select a notification: it is marked as read, and where it points at a
record, that record opens. Or use
Mark all as readat the top of the panel to clear the badge in one action. -
Select
View all notificationsat the foot of the panel to open/notifications. That page adds aCategory:filter, anUnread onlytick box, tick boxes for marking several as read at once, a delete control on each row, paging, and aPreferenceslink for choosing what you are notified about. Deleting asks you to confirm first, and cannot be undone. With nothing outstanding it readsNo notifications found, withYou're all caught up!beneath.
The AI assist
Three AI affordances live in this frame. All three only propose: a person reads
the output and decides what to do with it. Nothing is written to a record unless
you choose to save it — the attention briefing and the metric explanations, for
instance, offer a
Save as record action you have to select yourself, and what you
save appears in the insights list below the dashboard grid.
-
What needs my attention?— on the dashboard toolbar. It writes a short briefing of what is pressing across your modules right now. -
The
?on theCompliance,Policies,Open Risks,VendorsandPending Reviewscards — explains that metric in plain words: what it counts and what moves it. -
Ask AIand the floating button — open the assistant to ask about the screen you are on or to draft text you then edit.
AI answers can be wrong, and each billable AI action draws on your organisation's credit allowance. The AI assistant and agents covers what is metered and how the assistant is governed.
Tips and limits
If a module is missing from your sidebar, it is either outside your organisation's licence tier or gated to a higher role. A Viewer sees the same pages as a Contributor but without the controls that create or change things. Ask an Admin if you think you should have access.
-
The dashboard refreshes itself about every five minutes, and
Refreshpulls new figures immediately. Other modules do not — reload the page if you are watching something change. -
Customizerearranges, resizes, adds and removes dashboard widgets; the layout is saved to your account, not your organisation's. The dashboard chapter walks that through. -
A card that says it is not configured is a prompt to connect a source, not a
fault.
Vulnerability IntelligencereadsNot configuredin the capture because no feed is connected there; once one is, it shows live counts. -
The
Getting Startedbanner disappears once every step is done, or when you dismiss it with the×. Dismissing hides it for you alone; the checklist stays at/getting-started. - Your organisation may ask you to set up multi-factor authentication (a second sign-in step); if so, a reminder banner can appear under the dashboard title until you do.
- Language, theme, sidebar width and open groups are all personal settings. Language and theme follow your account; sidebar width and group state are held in the browser you are using, so a different machine starts from the defaults.
Where this connects
If you have not signed in yet, start at Signing in. Next, work through First-time setup so Aegis knows which rules apply to your organisation, then read the dashboard chapter for what each widget shows and how to rearrange them. The left menu at a glance maps every module to its chapter, Roles at a glance explains why your menu and buttons look the way they do, and Getting help covers what to do when something is missing or stuck.