Peer Benchmarking
Read your own compliance figures — control compliance, audit readiness, evidence freshness, policy and vendor counts — beside an anonymised peer or published industry comparison, so you can see where you stand and where to look next.
Peer Benchmarking answers one question: how do we compare? It takes five numbers Aegis already derives from your existing records and sets each one beside an average, a median and a percentile rank. Anonymised means the comparison figures carry no organisation names — they are pooled so that no single contributor can be picked out. The page is read-only: it never changes a control, a policy or a piece of evidence, and it never passes or fails you. It tells you where to point your attention; the judgement stays with your team.
Who uses it
Everyone with an Aegis employee account can open this page — it is a reading surface, so there is nothing to create or edit on it.
-
Viewer,
Contributor,
Manager and
Admin all hold the
View Benchmarkspermission, so all four roles see the same cards and the same figures. If your account somehow lacks the permission, opening/benchmarkingsends you to/unauthorized. - Only an Admin can opt the organisation in and set the industry and company size that decide which peer pool and which industry baseline you are measured against. That switch lives in Settings, not on this page — see Settings. A Manager cannot change it: sharing the organisation's scores is a consent decision kept for administrators.
Two switches control this page, both named PEER_BENCHMARKING.
The first is a licence feature: without it, the page keeps its
Peer Benchmarking heading but replaces the cards described
below with a centred chart icon and a line saying peer benchmarking is not
available on your current plan. The second is the module your operator
provisions: with that switched off, Peer Benchmarking is not in
the menu at all and a direct visit to /benchmarking returns you
to the dashboard. Speak to your administrator if you expect comparison data
and do not see it.
What's on this screen
The page opens under the heading Peer Benchmarking. Directly
beneath it sits a single grey summary line:
"Compare your compliance posture against anonymized scores from at least 5
other organizations, or against public industry baselines until enough
organizations take part."
When an administrator has set your industry and company size, Aegis appends them
to that same line in readable form — for example
"Industry: Financial Services. Size: Micro." — so you always know which
group the figures describe. In the captured screen the line ends after the
sentence above, with no industry or size added, so none was stored for that demo
organisation. There is no toolbar, no filter bar and no export button; nothing
on this page is configurable from here.
Below that summary line, a blue notice bar appears whenever your organisation
has
not
opted in to peer benchmarking. Both versions open the same way —
"Peer benchmarking is off — the comparisons below use public industry
baselines for your configured industry and company size."
— and then differ by role. An
Admin sees
Settings → Benchmarking as a link straight to the opt-in screen,
followed by a note that opting in shares your anonymised scores with the Euraika
control plane and compares them against other organisations once at least five
take part. Everyone else sees the version in the captured screen, which ends
"An administrator can opt in under Settings → Benchmarking."
with no link, because the settings screen is Admin-only and a link would be a
dead end. While that notice is showing, the comparison figures come from a
published
industry baseline (public industry
statistics) rather than from live peers.
Under the notice sits a grid of metric cards: five cards, laid out three across on a wide screen, two across on a tablet and one per row on a phone. Each card reads top to bottom as the metric name with a tier badge on the right, your own value in large type, a one-line description of what that value measures, then a divider and the comparison block.
If Aegis could not load your role, a banner above the heading reads
"Your permissions could not be loaded, so some actions are hidden."
with a Try again button. On this page nothing is hidden by role
apart from the settings link in the notice, so the figures are still safe to
read.
-
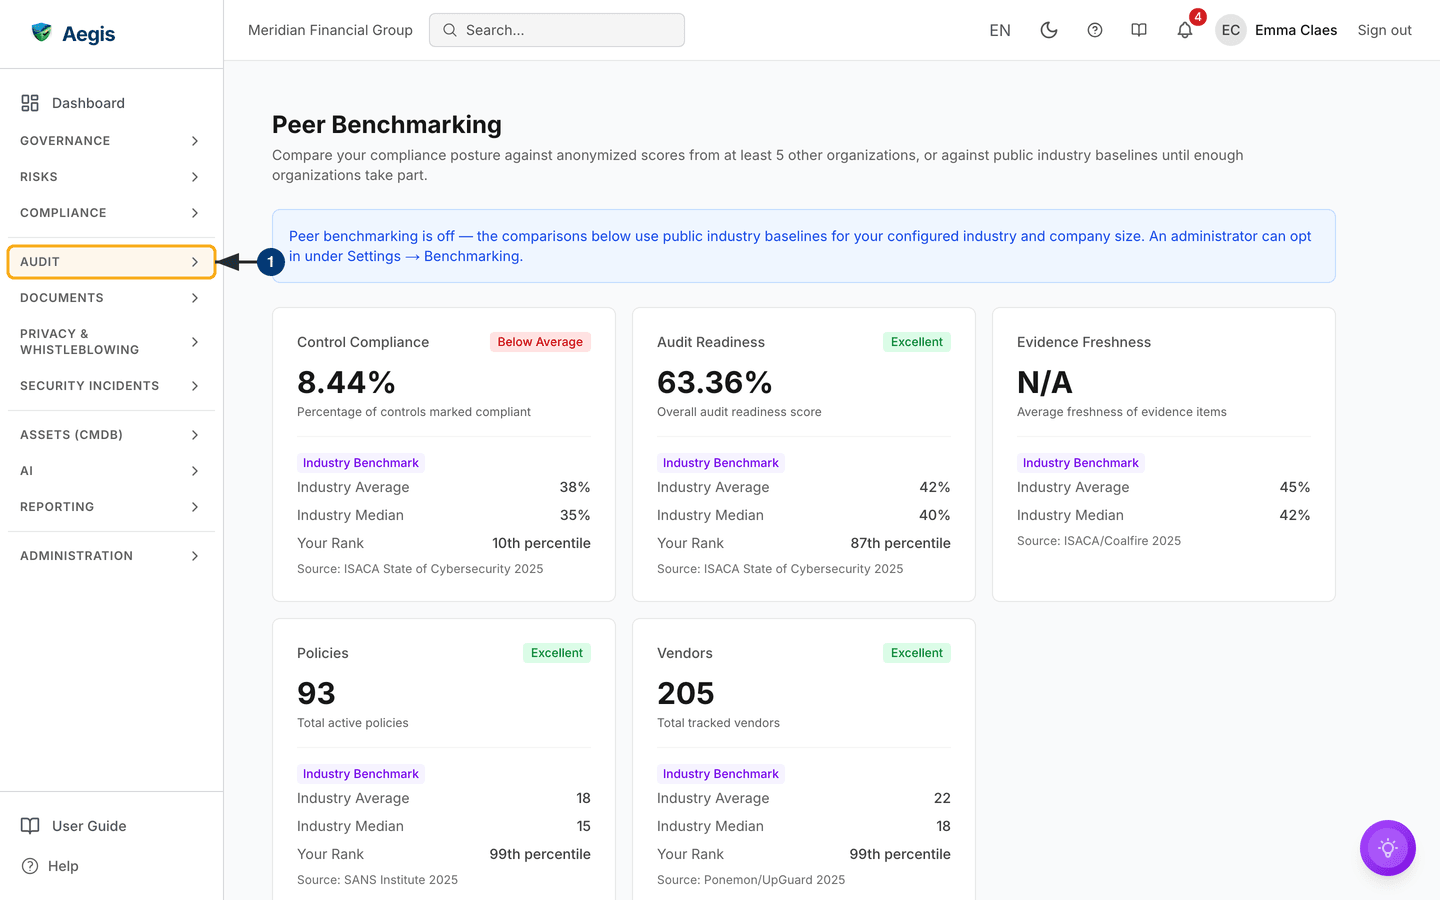
Open the Audit group in the left sidebar and choose
Peer Benchmarking. The page loads at/benchmarking, showing a grey skeleton for a moment while Aegis fetches your figures, then the summary line, the notice bar if your organisation has not opted in, and the five metric cards.
Scroll past the cards. When comparison data is available, a
Peer Comparison & Maturity section follows with a maturity
gauge, a radar chart and a per-dimension table. It sits below the fold, so it
falls off the bottom of the screenshot above.
Reading a metric card
The five measures are all derived from records you already keep, so this page needs no extra data entry:
| Card | What it measures |
|---|---|
Control Compliance |
Percentage of controls marked compliant. |
Audit Readiness |
Overall audit readiness score. |
Evidence Freshness |
Average freshness of your evidence items. |
Policies |
Total active policies. |
Vendors |
Total tracked vendors. |
The comparison block under the divider changes with the data source. On baseline
data it carries a violet Industry Benchmark tag and lists
Industry Average, Industry Median,
Your Rank as a percentile, and a Source line crediting
the published statistic — the captured screen credits
ISACA State of Cybersecurity 2025,
ISACA/Coalfire 2025, SANS Institute 2025 and
Ponemon/UpGuard 2025. Hovering over a Source line
shows a short description of the sample behind it. On live peer data the tag and
the source line disappear and the labels read Peer Average,
Peer Median, Your Rank and Peers, the
last being the number of organisations in the pool.
The tier badge in the corner is set by your percentile rank, not by an absolute target:
| Badge | Percentile rank |
|---|---|
Excellent |
75th percentile or higher |
Good |
50th to 74th |
Average |
25th to 49th |
Below Average |
Below the 25th percentile |
Because the badge follows the rank, the same kind of number can earn very
different badges. In the captured screen Audit Readiness reads
63.36% at the 87th percentile (Excellent), while
Control Compliance reads 8.44% at the 10th percentile (Below Average) against an industry average of 38% — a direct prompt to go and look at your
controls in Compliance frameworks.
Where Aegis has no figure of your own for a measure it prints
N/A rather than guessing. The card still shows the industry average
and median for reference, but with no value to place there is no
Your Rank line and no tier badge — the
Evidence Freshness card in the captured screen is in this state. A
card with no comparison data at all reads
"No peer data available yet" under the divider.
Peer Comparison & Maturity
Below the cards, when the comparison data loads, Aegis adds a section headed
Peer Comparison & Maturity. It is not visible in the captured
screen above — scroll down to reach it. It holds three or four parts:
-
A maturity score card: a composite score out of 100 drawn
as a gauge, with a level beneath it —
Excellentfrom 80,Goodfrom 60,Developingfrom 40 andInitialbelow that. If none of the dimensions has a figure on your side, the gauge reads—instead of a number and the label beneath it says "No own data yet", rather than showing a misleading zero. -
A radar chart plotting
Your Organizationagainst thePeer Averageacross the dimensions, with a shaded band for the middle half of the comparison group (the 25th to 75th percentile). It needs at least three dimensions with data; with fewer it prints "At least 3 dimensions are required to render a radar chart." -
A dimension comparison table with the columns
Dimension,Your Value,Peer Avg,PercentileandYour Trend. The dimensions areControl Compliance,Risk Maturity,Incident Response,Vendor ManagementandEvidence Freshness. A row on baseline data carries the same violetIndustry Benchmarktag; a row with too few peers reads "No peer data available yet"; a row with nothing on your side reads "No own data yet". The trend column shows a coloured arrow — ↑ improving, → stable, ↓ declining — with the change in points beside it once there is an earlier snapshot to compare against. If the table has no rows at all it reads "No comparison data available." -
A maturity trend sparkline headed
Your Maturity Trend, shown only once Aegis has recorded more than one snapshot of your score, so it takes time to appear on a new tenancy.
The metric cards and this section come from different requests. If the comparison request fails or has nothing to return, the section is left out and the cards above still render normally. That is deliberate — a missing comparison never blanks your own figures.
Switching from industry baseline to live peer data
Until your organisation opts in, every card compares you against published
industry statistics. Opting in changes the comparison to live, anonymised data
from other organisations in the same industry and size bracket. These steps are
for an
Admin; any other role that opens
/settings/benchmarking is sent to /unauthorized.
-
Open
Settings → Benchmarking— from the link in the blue notice bar if you are an Admin, or from the Settings menu. TheBenchmarking Settingspage opens with aPeer Benchmarkingpanel, a short description and an opt-in switch at its top right. -
Read the blue
Data & Privacynote under the description. It states that only aggregated metric values are shared, tagged with your industry and size bracket, with no names, users or records, and that the Euraika control plane only ever returns averages, medians and quartiles of at least five other organisations. - Choose your Industry from the list (Financial Services, Healthcare, Technology, Manufacturing, Energy & Utilities, Retail & E-Commerce, Government and others) and your Company Size bracket (Micro 1–9, Small 10–49, Medium 50–249, Large 250–999, Enterprise 1000+). Both lists are active whether or not you opt in: they choose the industry baseline your cards use straight away, and, once you opt in, the peer pool you join.
- Turn on the opt-in switch. It turns green. Opting in starts a weekly job that keeps your scores in your own deployment as trend history and shares the same scores with the Euraika control plane for comparison.
-
An amber bar appears below the panel reading
"You have unsaved changes." Select
Save Changesin it to store the configuration. A "Benchmarking settings saved" message confirms it and the amber bar goes away. -
Return to
/benchmarking. The blue notice bar is gone and the summary line now names your industry and size. Each card switches toPeer Average,Peer Medianand aPeerscount once at least five other organisations in your group have shared a score for that measure; until then it stays on the industry baseline.
Live peer figures exist only because organisations contribute their own. Joining the pool means your anonymised numbers count towards other organisations' comparisons too. No organisation names are shared, and no organisation sees another's scores. Your own organisation never counts as one of your peers. A peer comparison needs at least five other organisations and a value of your own for that measure; below that, the card keeps the industry baseline rather than showing figures from a group too small to read much into. Because scores are shared weekly, expect the switch to take time on a newly opted-in tenancy.
Turning the switch off and saving stops sharing and withdraws the scores you submitted. Nothing is shared while the switch is off. Your cards return to the industry baseline.
When the page will not load
If a request fails, the page keeps the heading and replaces the content with a
red box carrying one of three messages.
"Feature not available on your plan." means the
PEER_BENCHMARKING licence feature is off — an administrator or your
Euraika contact can confirm. "Failed to load benchmarking data." and
"Failed to connect to the server." are both worth retrying with a page
refresh before you report them; see
Getting help if they persist.
If the page itself fails while it is drawing, Aegis shows a centred
"Something went wrong" panel instead, with a
Try Again button that redraws the page and a
Go to Dashboard button.
Tips and limits
- Nothing here is saved. The page reads your data and re-fetches it on every visit, so a refresh is the way to pick up new figures.
-
Percentile ranks and tier badges are relative.
Below Averagemeans others in your group score higher on that measure — it is a steer on where to look, never a compliance verdict, and it does not mean an obligation has been breached. Take a weak rank as a question to carry into the relevant module. -
Industry-baseline figures come from published statistics, each credited on
its
Sourceline. They are a stand-in until you have live peers, not a measurement of organisations like yours. - The numbers are only as current as the records behind them. If controls have not been reviewed or evidence has not been refreshed, the comparison reflects that rather than your real position — keep the underlying modules up to date.
- The comparison is only as meaningful as the industry and size an administrator has set. A mismatched bracket puts you against the wrong baseline and the wrong pool.
Where this connects
-
Compliance frameworks — where the
Control Compliancefigure is set, control by control. -
Audit readiness — the source of the
Audit Readinessscore. -
Evidence — keeping evidence current feeds
Evidence Freshness. -
Policies and
Vendors — the records behind the two count cards;
vendor reviews also feed the
Vendor Managementdimension. - Risks and Incidents — behind the Risk Maturity and Incident Response dimensions in the comparison table.
- Analytics — trends and heatmaps for your own posture over time, which is the internal counterpart to this outward comparison.
- Settings — where an administrator opts in and sets the industry and company size.
- The left menu — where the Audit group and this page sit in the navigation.